What happened in the 2017 Minnesota housing market and how will it affect 2018 home sales?
Data from the 2017 Annual Report on the Minnesota Housing Market FOR RESIDENTIAL REAL ESTATE ACTIVITY IN THE STATE OF MINNESOTA
2017 MN HOUSING QUICK STATS
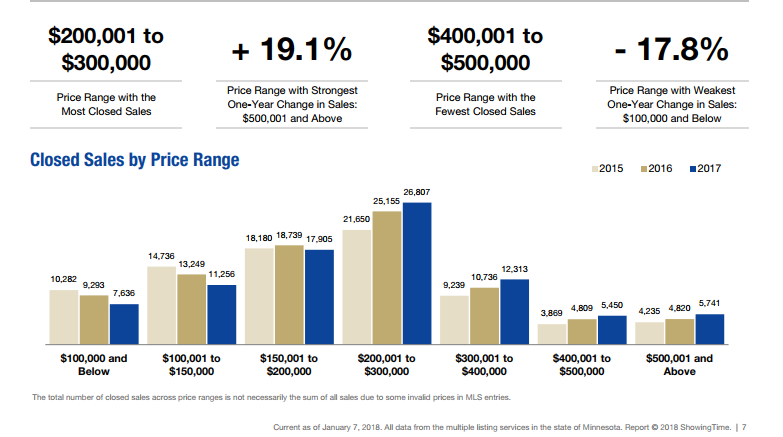
- The hottest price range in MN was $200,000 - $300,000
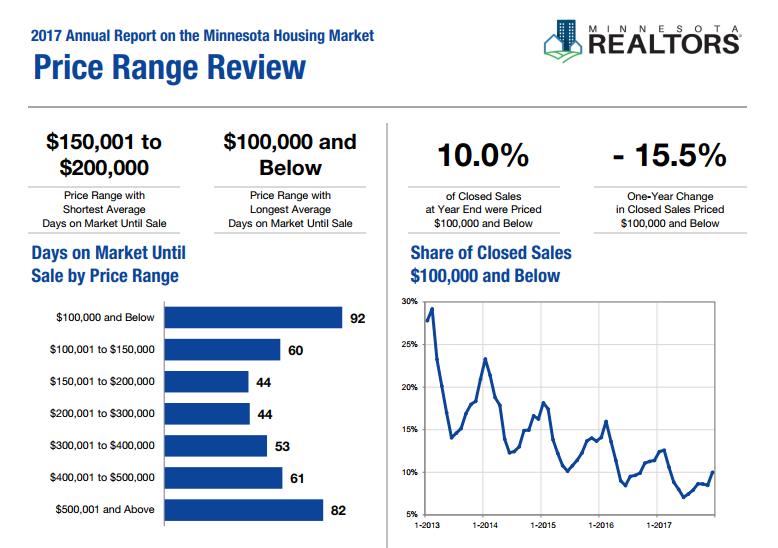
- Homes average 44-92 days on the market
- Pipestone County had the highest Lender-Mediated Market Share in 2017 at 13.6%
- Watonwan County had the highest percentage of foreclosure sales at 8.5%.
- Big Stone County, Grant County, Houston County, Kittson County, Lac Qui Parle County, Lake of the Woods County, Lincoln County, Marshall County, Norman County, Pope County, Red Lake County, Roseau County, Swift County, Traverse County and Wilkin County all had 0% foreclosure sales.
- Owners receive on average 97.2% of Original List Price


MN residential home sales, listings and foreclosures:

What does this mean for MN home buyers in 2018?
There are fewer homes on the market making the home selection slim. Your search will take longer or those with the need to move quickly will likely need to settle on a home.
Finding a deal on a foreclosure is going to be tough - and when you do there will likely be multiple offers - so buyers need to have cash in hand and competitive terms.
What does this mean for MN home sellers in 2018?
There are fewer homes on the market making the home competition slim. While this sounds like a market ripe for sellers to take advantage of buyers, saavy buyers have more access than ever to data and inspections. Most buyers obtain financing subjecting properties to a 3rd party appraisals assuring negotiated sales prices are inline with the local market. Proper pricing and home maintenance/presentation is critical to market sale success.
MN Housing Sales Stats
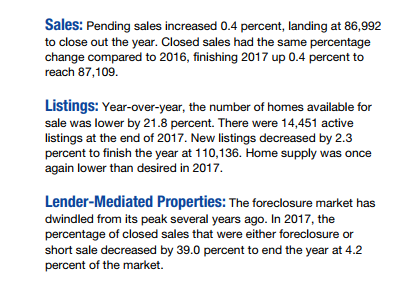
Total Closed Home Sales: 87,109
Change from 2016: + 0.4%
Percent Foreclosures: 1.7%
Percent Short Sales: 0.6%
PercentTraditional: 95.8%
Days on Market Until Sale: 55
Pct. of Orig. Price Received: 97.2%
MN Housing Sales Stats by County
7-County Twin Cities Region Total Closed Sales: 51,622
Change from 2016: 0.2%
Percent Foreclosures: 1.5%
Percent Short Sales: 0.7%
PercentTraditional: 95.9%
Days on Market Until Sale: 40
Pct. of Orig. Price Received: 98.4%
Hennepin County Total Closed Sales: 20,679
Change from 2016: 1.1%
Percent Foreclosures: 1.4%
Percent Short Sales: 0.6%
PercentTraditional: 96.4%
Days on Market Until Sale: 40
Pct. of Orig. Price Received: 98.3%
Dakota County Total Closed Sales: 7,580
Change from 2016: 0.1%
Percent Foreclosures: 1.4%
Percent Short Sales: 0.8%
PercentTraditional: 95.6%
Days on Market Until Sale: 38
Pct. of Orig. Price Received: 98.6%
Ramsey County Total Closed Sales: 7,392
Change from 2016: 0.5%
Percent Foreclosures: 1.8%
Percent Short Sales: 0.6%
PercentTraditional: 95.1%
Days on Market Until Sale: 38
Pct. of Orig. Price Received: 98.3%
Anoka County Total Closed Sales: 6,201
Change from 2016: + 0.6%
Percent Foreclosures: 2.3%
Percent Short Sales: 0.8%
PercentTraditional: 94.5%
Days on Market Until Sale: 40
Pct. of Orig. Price Received: 99.1%
Washington County Total Closed Sales: 4,980
Change from 2016: + 2.9%
Percent Foreclosures: 1.0%
Percent Short Sales: 0.7%
PercentTraditional: 96.7%
Days on Market Until Sale: 45
Pct. of Orig. Price Received: 98.0%


